On this page, I will present some (preliminary) findings related to numeracy (math) development in our sample.
In the first plot, we see the arithmetic fluency scores of all children, across all five time points. Scores for addition and subtraction are added together. Each line represents one child.
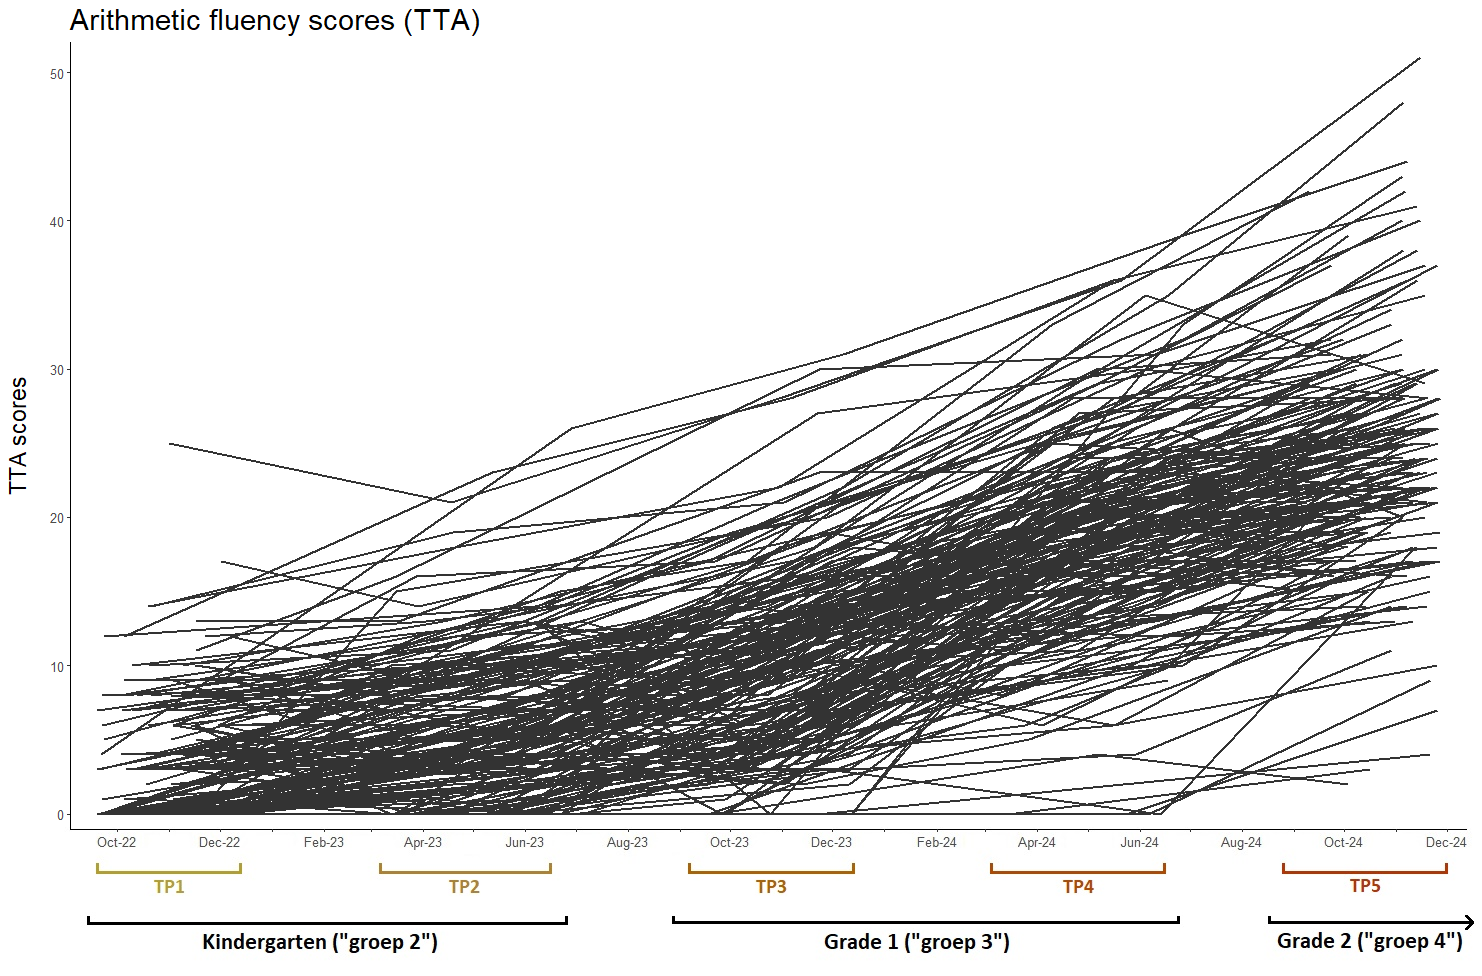
We can see that there’s a lot of variation in children’s arithmetic fluency in early primary school.
Now, we want to find out which cognitive skills (and which factors from the home environment) are associated with these individual differences in arithmetic fluency.
To shed some light on this, let’s take a look at this animated plot where the arithmetic fluency scores are shown again, but now a color scale is added. Just like for reading (on the previous page), this color scale represents each child’s phonological skills at the first time point (kindergarten). Just as for reading, we see that children who start with ‘low’ phonological skills in kindergarten (in light blue) show less fluent arithmetic abilities, and this effect is still visible 2.5 years later, at TP5.

Next, we can make a very similar plot, but now the color scale represents each child’s counting skills at the first time point (kindergarten). We see a very similar pattern: children who start with ‘low’ counting skills in kindergarten (in light blue) show less fluent arithmetic abilities, and this effect is still visible 2.5 years later, at TP5.
_____________________________________________________
Longitudinal latent profiles:
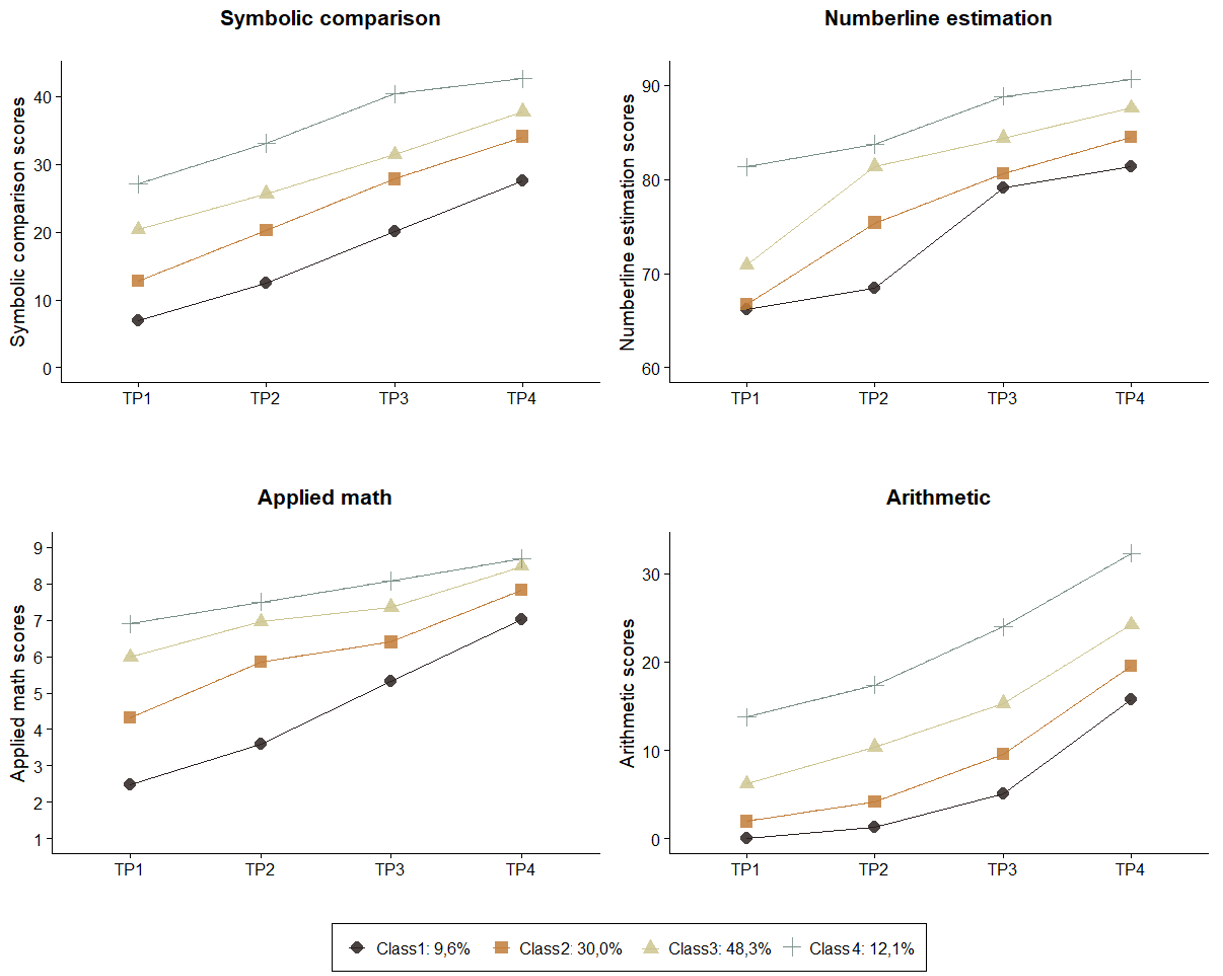
In our newest paper, we are using repeated-measures LPA (RMLPA) to examine the distinct latent longitudinal profiles in early numeracy development across early primary school. In our results, we identified four latent profiles for numeracy. In the plots below, we can see how the group of children with ‘low’ numeracy/math skills (and those with ‘high’ skills) differ from the other profiles.
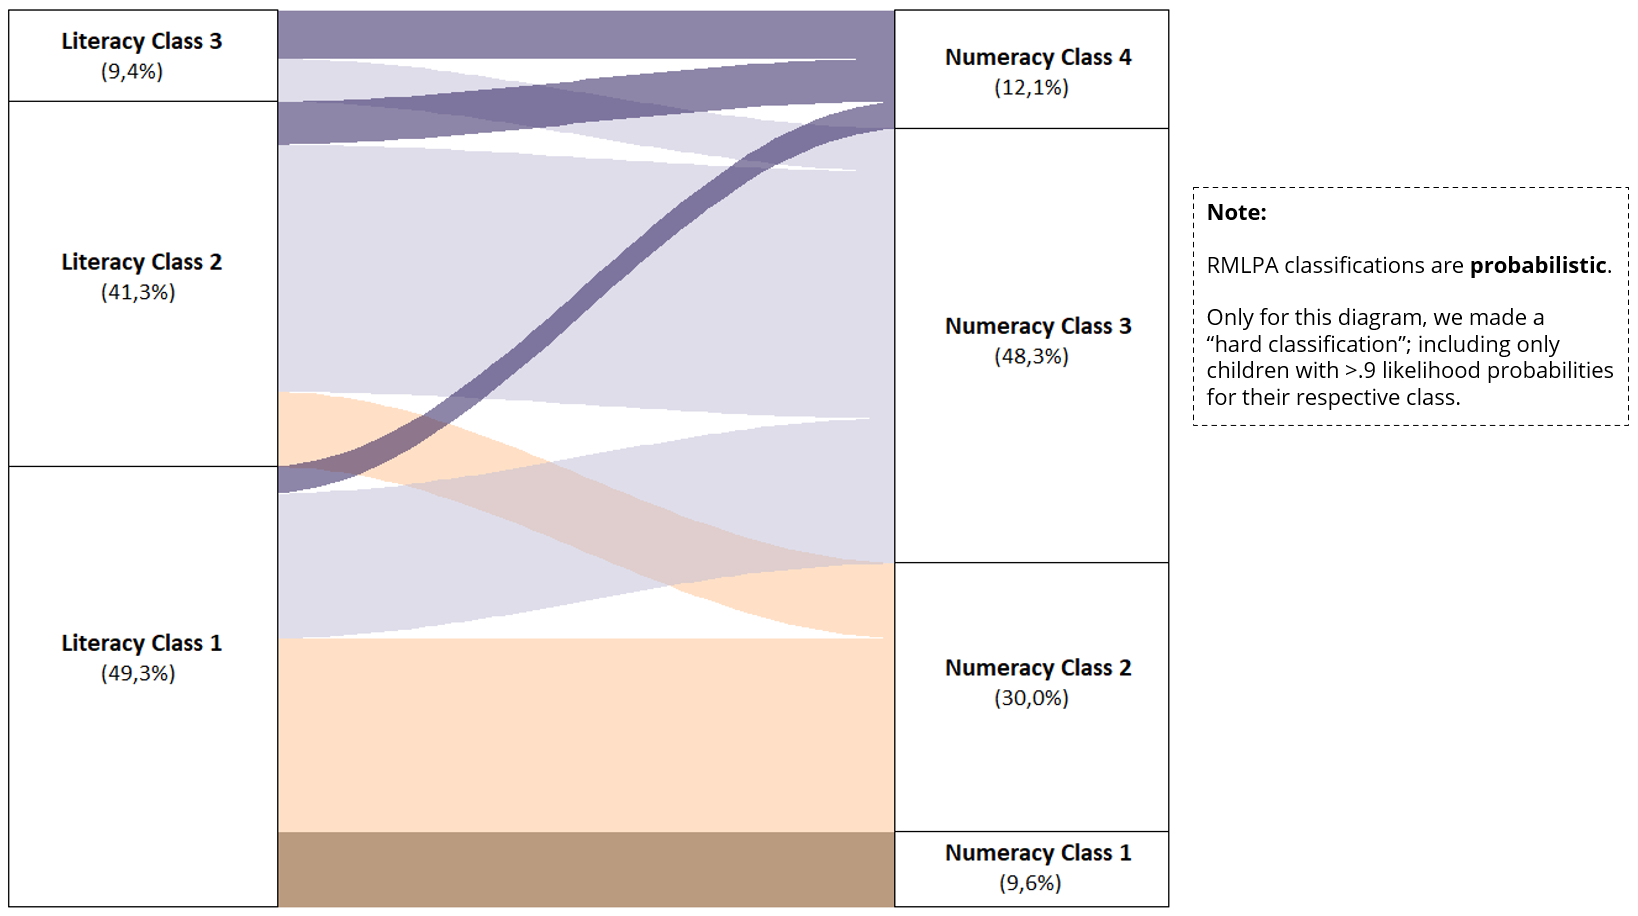
On the previous page, we looked at the latent longitudinal profiles for early literacy development. The diagram below shows the ways in which children from each Literacy profile are represented in the Numeracy profiles, and vice versa. Interestingly, we can see that all children in the ‘low’ Numeracy profile are represented in the ‘low’ Literacy profile, while the reverse is not true.